
LLM Production Architecture: Why Prompt Engineering Alone Falls Short
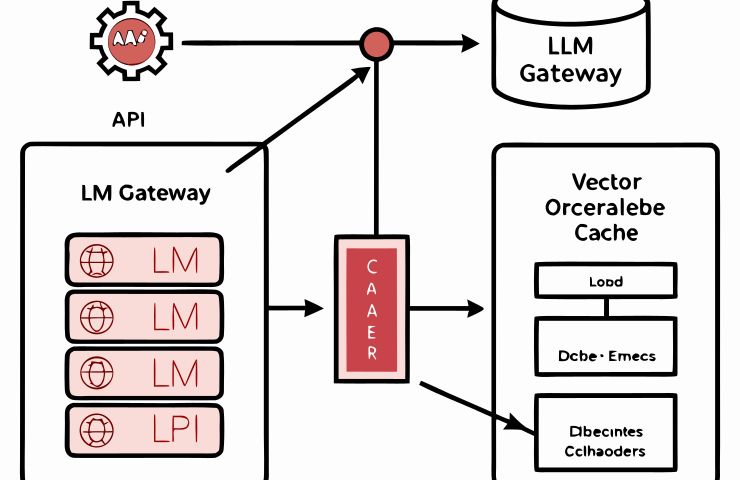
LLM Production Architecture demands fresh design choices. Treating language models like standard APIs led teams to repeated dead ends: exploding bills, unpredictable delays, and no clue when things go wrong. Investors, take note: prompt tweaks alone won't tame this beast. A disciplined infrastructure approach is now non-negotiable.
The Cost Imperative
Token-based pricing creates a direct line from architecture to the bottom line. Every token sent or received hits your bill. CloudZero data shows model rates can vary up to 600x. A handful of extra calls and sloppy prompts can drive cost spikes into six figures in no time.
Simple caching cuts waste. KV caching reuses key-value pairs from attention layers, shaving about 0.15ms per token. Semantic caching goes further—vector embeddings match similar requests in under 5ms and bypass fresh model calls that take 2–5 seconds. Hitting 30–40% cache rates translates to real savings on both tokens and latency. Ignore caching, and you pay full freight.
Traditional compute costs hide per-request expense behind flat infrastructure fees. With LLMs, every wasted token is a visible line item. Architects must map token flow, set budgets per feature or user cohort, and enforce them. Without that guardrail, token bill shock is inevitable.
In large deployments, token waste adds up fast. Multiply millions of interactions and even a 10% improvement in prompt efficiency can save hundreds of thousands annually. Engineering teams should target redundant call elimination, prompt brevity, and cache hit rates above 40% as core metrics alongside revenue and growth forecasts.
Latency Dynamics
Applications with text generation feel slow when the first word takes ages. Users judge performance by time-to-first-token (TTFT). Drop TTFT by 100ms, and perceptions shift. Cache reductions of 1,000 tokens cut about 100ms off TTFT. That matters more than a 200ms improvement in total response time.
Next comes inter-token latency. Each token can add 20–100ms. Generating a 1000-token answer might take tens of seconds if you’re not careful. Batching requests and reusing caches can slash that delay. You’ll need serving frameworks like vLLM or TensorRT-LLM at an inference layer tuned for parallel requests.
Planning for peak load is critical. A sudden spike can overwhelm instances, trip autoscaling, and balloon TTFT. Horizontal scaling helps but costs extra. Smart request routing across providers can smooth load and protect user experience without breaking the bank.
You can’t treat LLM requests like a web ping. A spike of thousands of requests in a minute needs pre-warmed instances and smart queue management. Prep plans for cold starts, warm pools, and geo-distribution. Latency budgets belong in SLA conversations, not just developer tickets.
Observability Gaps
Traditional monitoring focuses on uptime, error rates, and average response times. Useful for APIs. Useless for LLMs. Models can “succeed” by returning nonsense. You need to know why it failed, not just that it did.
LLM observability demands token-level metrics, custom quality checks, and tracing through every stage. Start with distributed tracing—OpenTelemetry can track a request from the API gateway through retrieval, tool calls, and model inference. Tag each span with token counts, cache hits, and cost metrics.
Alerting should trigger on hallucination rates, prompt template errors, or anomalous token spikes. Dashboards need to map these signals back to features or customer segments. For regulated industries, tie in audit trails that record which documents were retrieved and why.
Without deep visibility, debugging turns into guesswork. A billing surge or latency bump can hide a small bug in the orchestration layer. You’ll burn engineering hours chasing ghosts.
Observability isn’t optional. It’s as critical as load balancing or security. Under-invest and you’ll pay with outages, overruns, or compliance fines.
Orchestration Complexity
Real-world LLM workflows rarely fit a single API call. You might run retrieval-augmented generation, call multiple models in sequence, parse JSON outputs, validate against business rules, then dispatch follow-up calls. Each step is non-deterministic.
Retries can secretly double your token spend. Failover logic might trigger cold starts. Dependencies across steps need coordination. Build small state machines or use frameworks that handle parallel calls, error retries, and timeouts gracefully.
Avoid stitching together ad-hoc scripts. Invest in orchestration platforms that expose metrics for each phase. That way, you can pinpoint where delays or errors originate.
For multi-agent systems, the complexity multiplies. One agent’s output feeds another’s input. Each exchange adds tokens and latency. Establish clear contracts between agents and monitor each handoff.
Architectural Patterns
- AI Gateway: A middleware layer sitting between client apps and LLM providers. Handles authentication, rate limiting, semantic caching, token metering and routing across providers. Tools: Kong with custom AI modules or specialized offerings like Proximal.
- Token Caching:
- KV caching stores attention key-value pairs to speed up repeated tokens. Saves ~0.15ms per token.
- Semantic caching uses vector embeddings to match similar prompts at ~0.90–0.98 thresholds, yielding 30–40% hit rates.
- Context Engineering: Designs the system prompt, retrieval layer, tool outputs and conversation history as one cohesive input. Cuts irrelevant context, fills gaps, and shrinks prompt length without losing result quality.
- Vector Database: Stores embeddings with HNSW or IVF indexes for fast similarity search. Underpins retrieval-augmented generation and semantic caching.
- Load Balancing & Scaling: Distributes requests across multiple serving instances using NGINX or cloud-native load balancers. Autoscale with Kubernetes or cloud auto-scaling groups to handle demand spikes.
- Distributed Tracing: Instruments the gateway, orchestration, and serving layers with OpenTelemetry. Tracks trace IDs through retrieval calls, model inference, and downstream services. Essential for root-cause analysis.
Combine these patterns into a platform layer so developers focus on product logic, not model plumbing.
Each pattern addresses a core failure mode. Gateways unify security and observability. Caching tackles cost and latency. Context engineering optimizes quality and token spend. Vector stores power retrieval. Autoscaling ensures reliability. Tracing ties it all together. Treat these as table stakes for any production LLM system.
Skipping any one area risks blow-ups. Rely on one provider’s API features alone and you’ll inherit their blind spots. Build off-the-shelf modules or open-source stacks, then layer on your business rules.
Teams adopting these patterns report 3–10x reductions in redundant API calls, 50% faster first-byte times, and dramatic drops in incident resolution times. Those numbers aren’t fluff—they’re what separate demo apps from revenue-generating systems.
Market Response
Developers aren’t waiting for cloud giants to solve every problem. Tool vendors and open-source projects have raced to fill the gaps. LangChain and LlamaIndex lead on orchestration. Proximal and Helicone tackle gateway and caching. Observability specialists like PromptLayer and Vellum focus on token tracking and quality metrics.
Cloud providers are bundling these capabilities. AWS, Google Cloud and Azure now offer managed LLM endpoints with built-in caching and tracing hooks. That integration lowers the barrier to entry, but lock-in and pricing models still demand a custom architecture review.
The open-source community isn’t standing still either. Frameworks like vLLM, TensorRT-LLM and vector platforms are maturing fast. Investors should watch consolidation and partnership moves—smaller vendors could be prime acquisition targets.
Implications & Warnings
Ignoring architecture carries real risks. Cost overruns can erode margins. Latency issues dampen user engagement. Visibility blind spots lead to surprise failures or compliance breaches. These aren’t edge cases—they’re happening at scale in enterprises.
On the flip side, well-architected systems unlock frontier models at scale. A 95% inference cost drop since 2023 means little if your token waste wastes 10x more. Efficient design can turn premium models into viable revenue drivers.
Organizational shifts are underway. Companies are spinning up dedicated LLM platform teams—think platform engineering meets AI ops. Expect hiring to focus less on prompt tinkerers and more on distributed system and DevOps experts.
Investors should prioritize companies demonstrating architectural rigor: evidence of caching, observability and orchestration baked into their stacks. Platforms lacking those controls may struggle to scale profitably or meet enterprise SLAs.
Regulated sectors add another layer. Audit trails of retrieval sources, reasoning chains, and tool calls become compliance requirements. On-prem deployments of open models gain traction where cloud APIs can’t meet transparency demands.
Conclusion
Prompt engineering helped us get here. But prompt tweaks alone won’t sustain production workloads. Investors and teams must treat LLMs as infrastructure—complete with gateways, caching, observability, and orchestration. That’s how you control costs, unlock performance and build reliable AI-powered products at scale.